

Malaysia Community Pharmacy Analysis 2026
Watch on YouTubeLicence register snapshot: 27 September 2026
Population estimates: 2026 · Household income: 2024 · Historical MOH series: 2021–2025
In Sabah, there are 15,251 people for every included community-pharmacy premise. In Kuala Lumpur, the figure is 5,538. Sabah’s ratio is about 2.8 times as high.
Malaysia’s 4,133 included community-pharmacy premises form a very different landscape from one state to another. Start with your state, then follow the evidence from national counts to district differences and pharmacy-group footprints. People per premise means the population divided by the number of included pharmacy premises. A higher figure means fewer recorded premises relative to population. This measure does not show travel distance, staffing capacity, service quality or whether local needs are met.
State pharmacy availability explorer
Choose a state and measure to explore the September 2026 snapshot.
Peninsular Malaysia
Sabah, Sarawak and Labuan
Select a state on the map or use the state selector. Small federal territories also have buttons. Boundaries: geoBoundaries / OpenStreetMap contributors, 2017, simplified under ODbL 1.0. Map geometry and the report’s September 2026 counts have different reference dates.
Sabah: 15,251 people per premise
National ratio: 8,321 people per premise. Higher values mean fewer recorded premises or licences relative to population.
- Included premises
- 247
- Active licence records
- 260
- Leading classified group by premises
- PMG Healthcare Group · 15.0% within this state
Compare all states
Higher population ratios mean fewer recorded premises or licences relative to population.
Active Type A licence records by state
Selangor has 1,209 active licence records, or 25.5% of the 4,747 included nationally—more than twice Johor’s 543. Together, Selangor, Johor and Kuala Lumpur account for 47.3% of the total. The concentration in these three areas shows where the largest absolute numbers of licence records are located. Licence counts do not represent pharmacist headcounts.
Active Type A licence records by state
Select a row to see its value.
Sabah: 260 active licence records
5.5% of 4,747 active licence records in this comparison.
Population-adjusted comparisons in the next figure give a different view: a large count does not necessarily mean more licences relative to the population.
People per active Type A licence record
Sabah has 14,488 people per active licence record, approximately 3.4 times Kuala Lumpur’s 4,241. Pahang, Terengganu, Labuan and Kelantan also exceed 10,000. The national figure is 7,244. States and federal territories below the national figure include Kuala Lumpur (4,241), Pulau Pinang (5,037), Putrajaya (5,781), Selangor (6,166), Sarawak (6,225), Negeri Sembilan (6,606) and Perak (7,181). The contrast between Sabah and Sarawak shows that East Malaysia does not form a single pattern at state level.
Population per active Type A licence record
Select a state to see its value.
Sabah: 14,488 people per licence record
Peninsular Malaysia
Sabah, Sarawak and Labuan
Select a state on the map or use the state selector. Small federal territories also have buttons. Boundaries: geoBoundaries / OpenStreetMap contributors, 2017, simplified under ODbL 1.0. Map geometry and the report’s September 2026 counts have different reference dates.
People per licence record = 2026 population ÷ included active licence records.
Community-pharmacy counts, 2021–2026
The MOH series rose from 3,513 premises in 2021 to a peak of 4,320 in 2024. Annual growth slowed from 12.3% in 2022 to 7.6% in 2023 and 1.7% in 2024, before the count fell 2.6% to 4,208 in 2025. The series therefore shows a slowdown followed by a decline in 2025. This analysis records 4,133 premises in September 2026, numerically 1.8% below the 2025 figure. However, differences in inclusion criteria and reference dates prevent direct comparison of the 2026 count with the earlier MOH figures from confirming a further national decline.
Community-pharmacy premises from 2021 to 2026
Select a row to see its value.
No entry selected.
Source: Laporan Statistik 2025, Pharmaceutical Services Programme (2021–2025). The separately constructed 2026 count uses different inclusion criteria and reference dates, so it does not establish a further national decline.
Community-pharmacy premises by state
Selangor has 998 included premises, or 24.1% of the national total, followed by Johor with 480. Kuala Lumpur (376) and Sarawak (375) have similar counts despite their different population sizes and geographical areas, while Sabah has 247 premises for approximately 3.8 million residents. These comparisons show why absolute counts need to be read alongside population ratios: near-equal totals do not establish equivalent availability. State totals also do not show how premises are distributed within each state.
Community-pharmacy premises by state
Select a row to see its value.
Sabah: 247 premises
6.0% of 4,133 premises in this comparison.
People per community-pharmacy premise by state
Sabah records 15,251 people per included premise, approximately 83% above the national figure of 8,321. Pahang, Terengganu, Labuan and Kelantan also exceed 10,000, so high ratios are not confined to Sabah. Kuala Lumpur has the lowest figure at 5,538, followed by Pulau Pinang at 5,759 and Sarawak at 6,773; Putrajaya records 7,141.
People per community-pharmacy premise
Select a state to see its value.
Sabah: 15,251 people per premise
Peninsular Malaysia
Sabah, Sarawak and Labuan
Select a state on the map or use the state selector. Small federal territories also have buttons. Boundaries: geoBoundaries / OpenStreetMap contributors, 2017, simplified under ODbL 1.0. Map geometry and the report’s September 2026 counts have different reference dates.
Compare two states
Your selected state
Sabah
| Measure | Sabah | W.P. Kuala Lumpur |
|---|---|---|
| Included premises | 247 | 376 |
| Active licence records | 260 | 491 |
| People per premise | 15,251 | 5,538 |
| People per licence record | 14,488 | 4,241 |
Sabah has 2.8 times the population per included premise of W.P. Kuala Lumpur, using the report’s rounded ratios.
People per premise is calculated by dividing the 2026 population by the number of included premises. The national ratio uses total population divided by total premises. This comparison does not establish which state provides better care or how far residents travel to a pharmacy. Sarawak’s below-national state ratio does not rule out local differences, which become clearer in the district analysis below.
State representation among the 20 highest district ratios
Sabah accounts for nine of the 20 districts with the highest people-per-premise ratios. Sarawak and Pahang contribute three each, Kedah two, and Terengganu, Perak and Negeri Sembilan one each. Sarawak’s presence despite its below-national state ratio illustrates how state averages can conceal district differences. Sabah and Sarawak together contribute 12 of the 20 districts (60%). This ranking highlights where high population-to-premise ratios recur, rather than how many districts in each state have high ratios overall. It also leaves out areas with no matched premises, which require separate assessment.
State representation among the 20 highest district ratios
Select a row to see its value.
Sabah: 9 districts
45.0% of 20 districts in this comparison.
Only districts with at least one matched included premise are eligible. The 24 areas with no matched premises are excluded; no match does not necessarily mean no pharmacy operates there.
Household income and pharmacy-premise availability
Six states have household incomes below the national median and people-per-premise ratios above the national figure: Sabah, Pahang, Kelantan, Terengganu, Perlis and Kedah. Kuala Lumpur, Putrajaya, Selangor and Pulau Pinang combine higher household incomes with lower ratios. Sarawak, Negeri Sembilan, Melaka and Perak have lower incomes and lower ratios; Perak is close to the national ratio. Johor and Labuan have higher incomes but also higher ratios. Johor’s approximately 4.2 million residents and 8,801 people per premise make it a sizeable exception to a simple income-based explanation. Together, these patterns suggest that household income alone does not explain differences in premise availability.
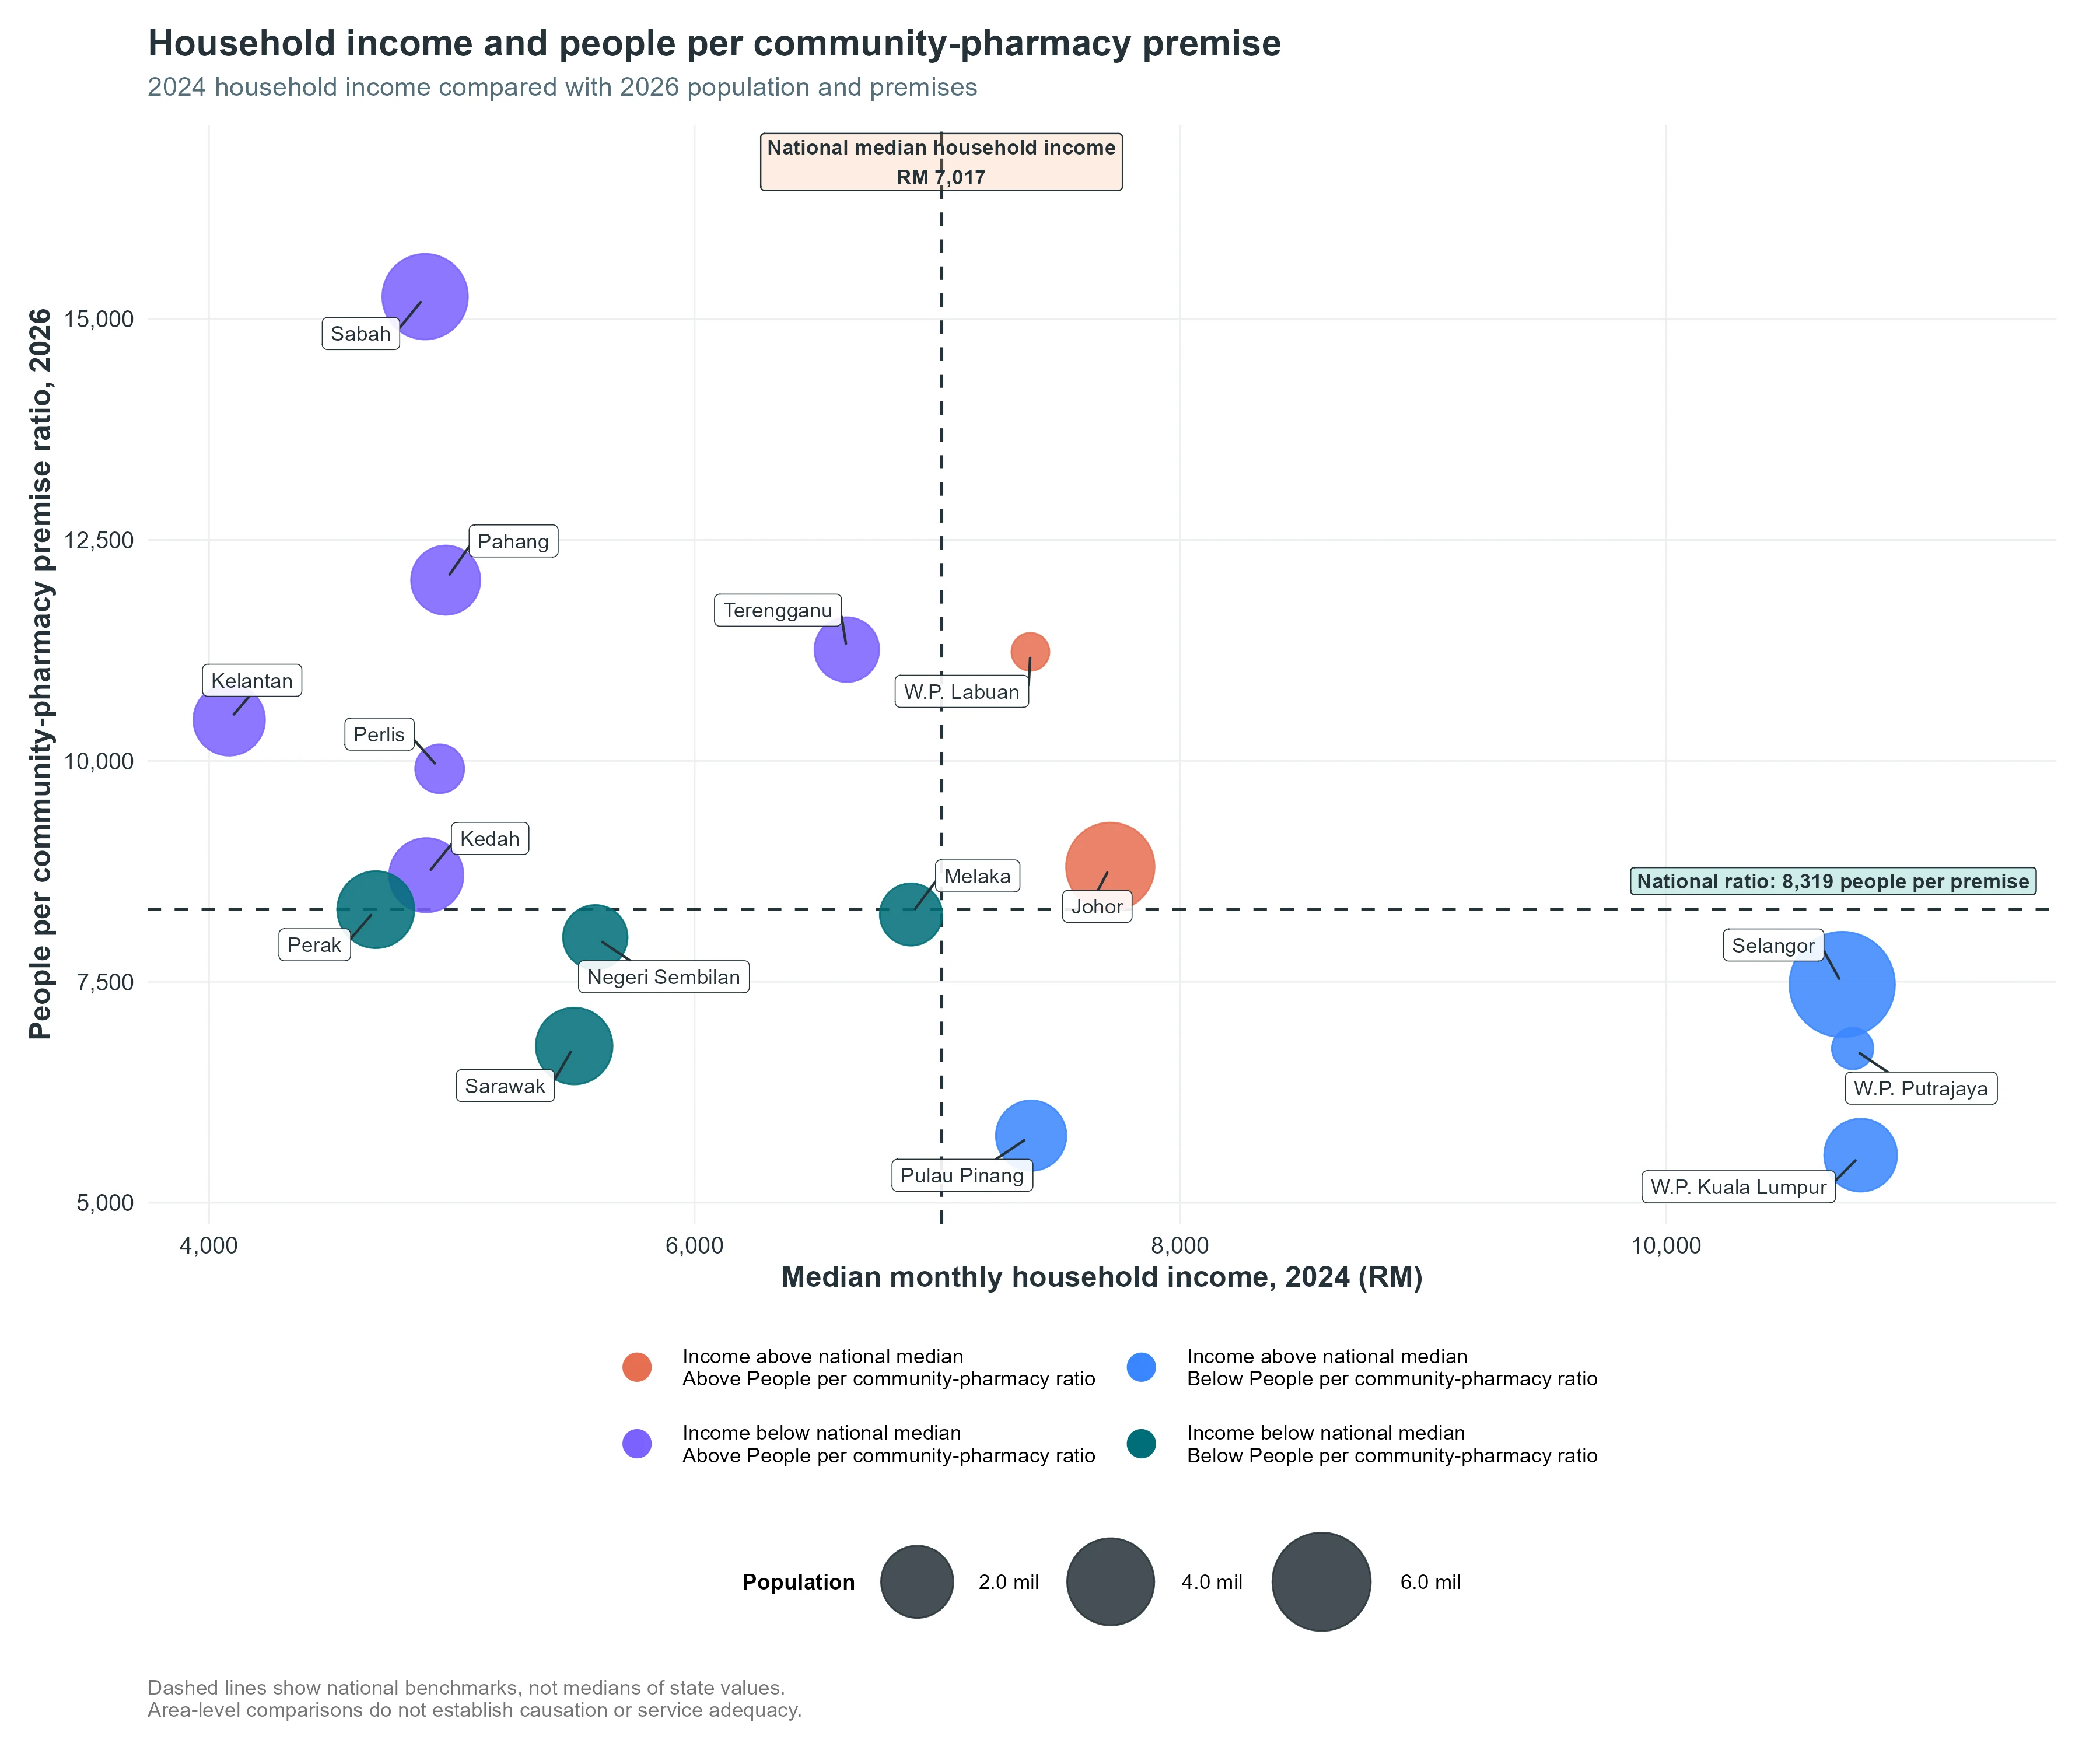
Bubble size represents 2026 population. Dashed lines mark national household income (RM7,017, 2024) and people per premise (8,321, 2026), rather than medians of state values. This area-level comparison does not establish causation or household affordability.
District population and pharmacy-premise availability
Twenty-seven of the 141 eligible analytical areas meet both screening thresholds: at least 127,200 residents and at least 11,433.33 people per premise. They represent 19.1% of eligible areas and combine relatively large populations with relatively few matched premises. The screening identifies areas that are relatively large and have high ratios within this sample. It does not rank commercial potential or establish unmet demand.
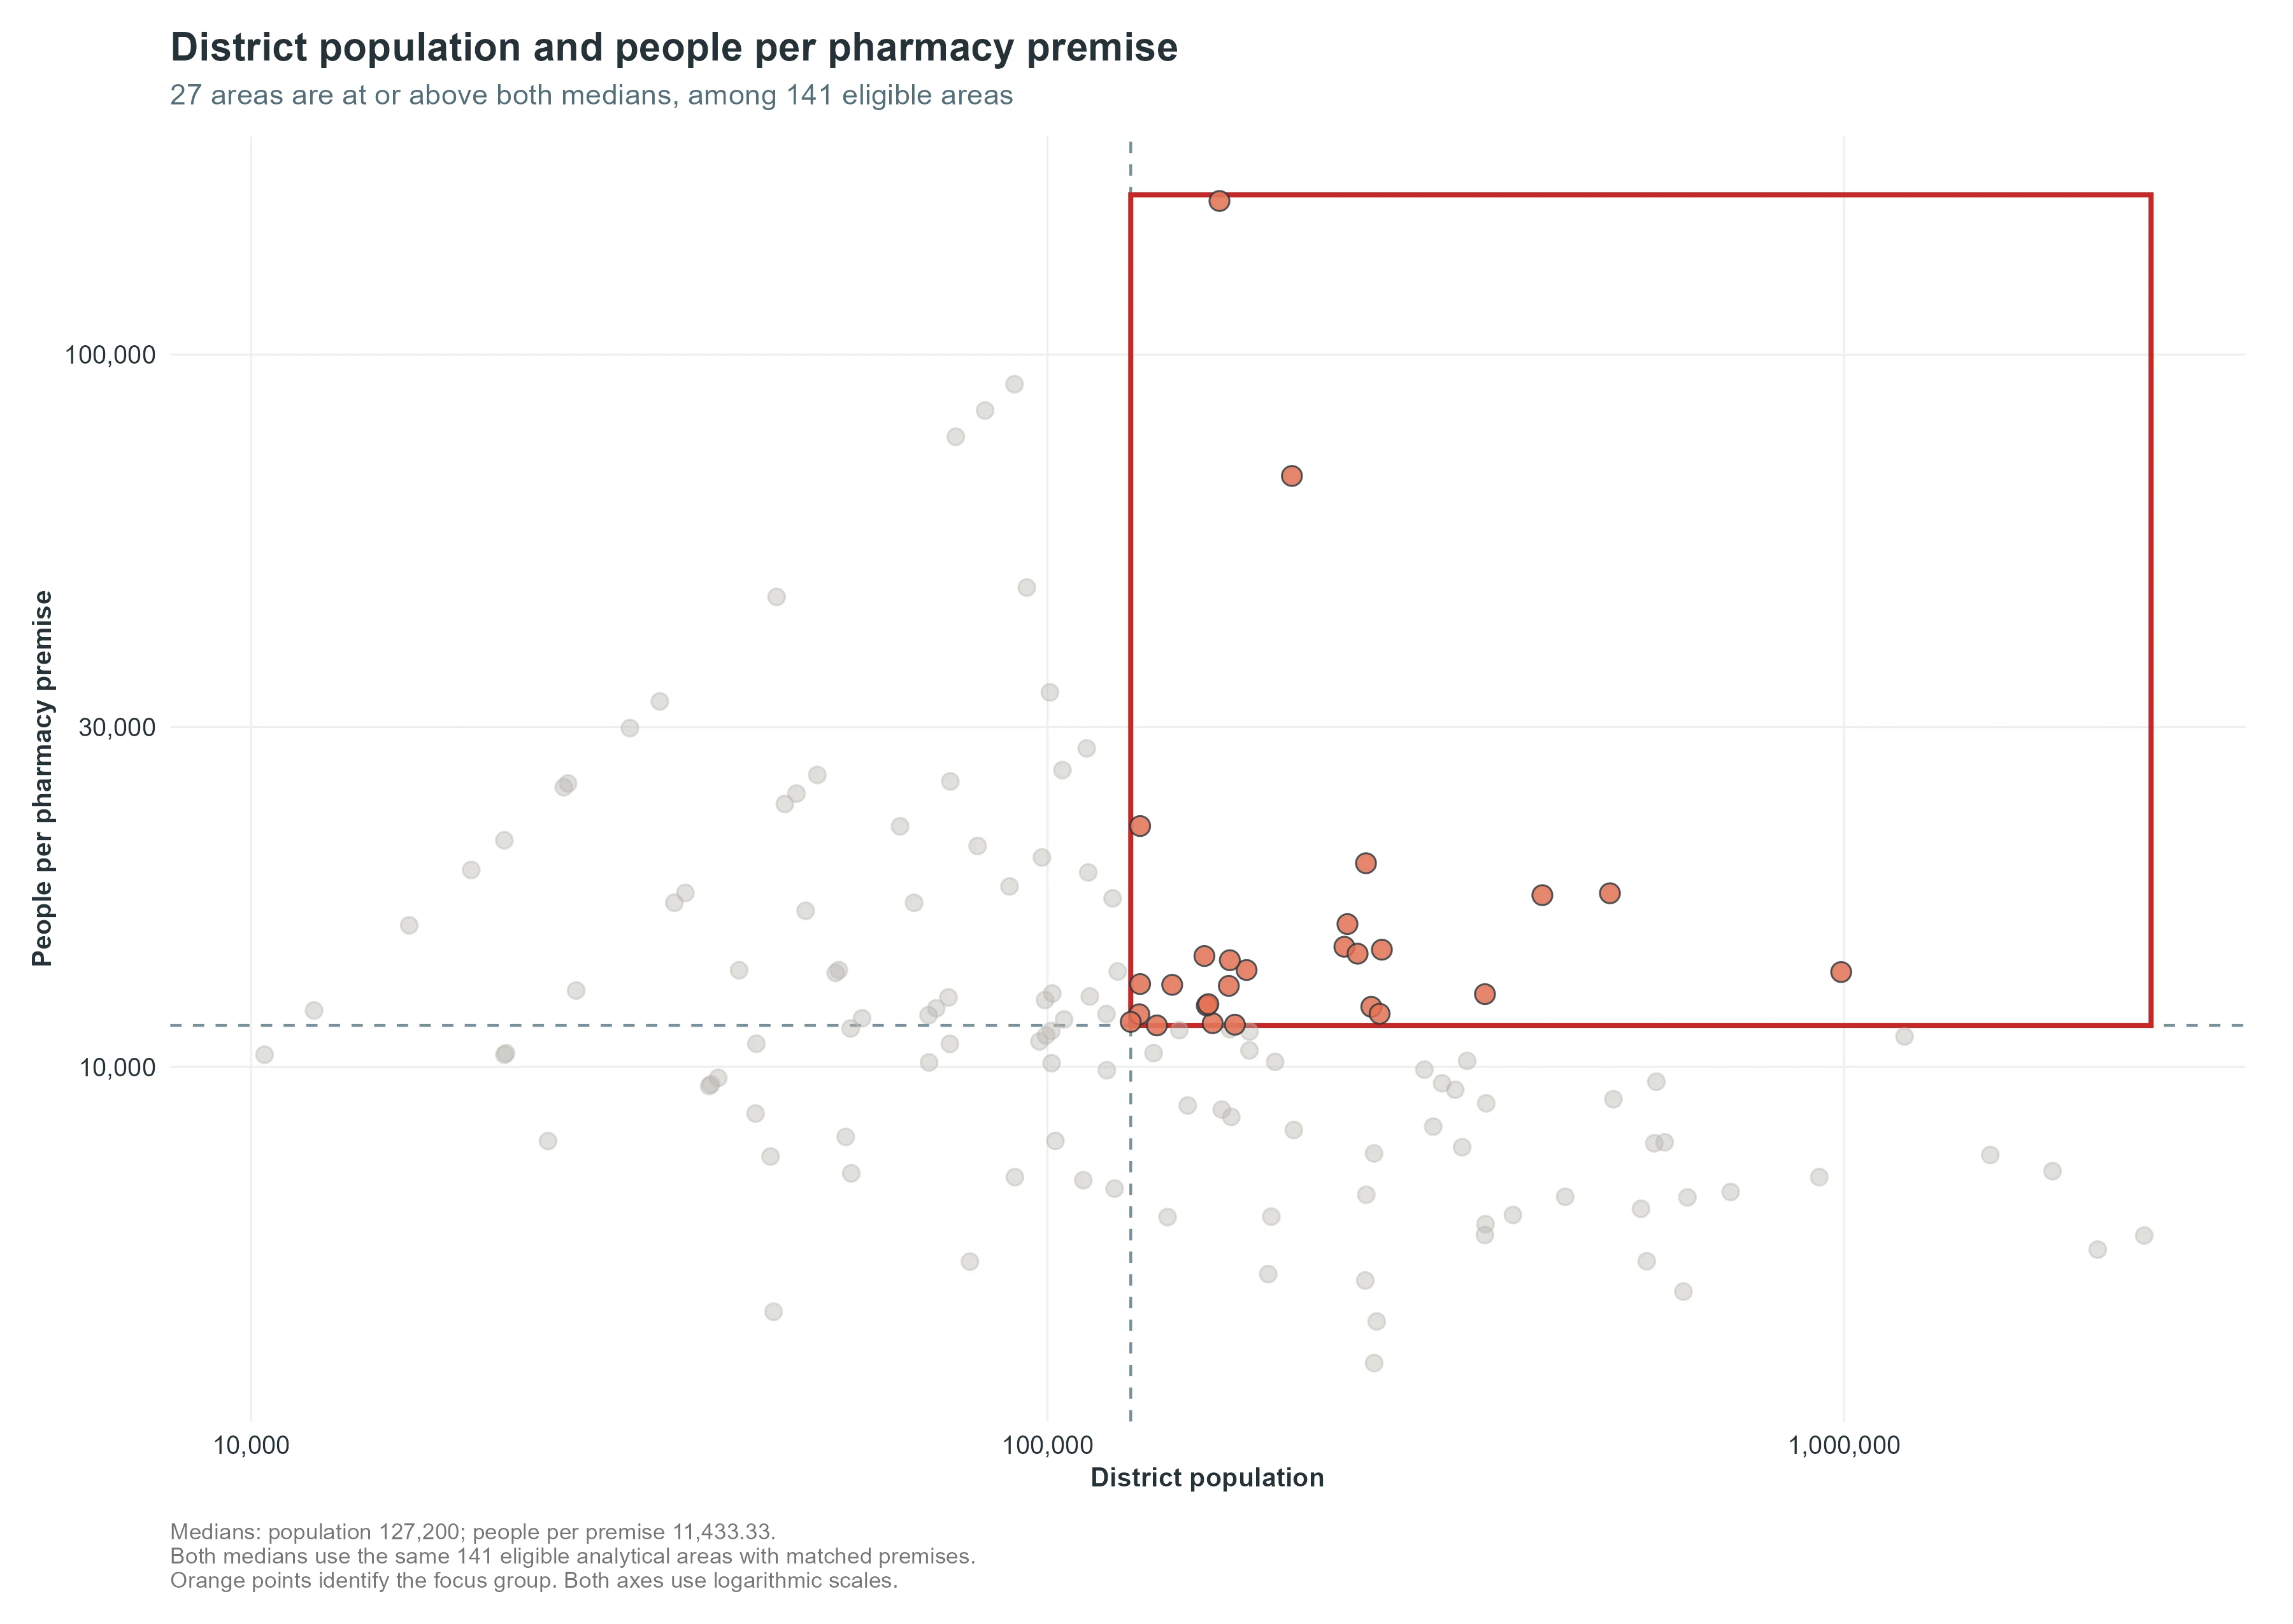
The district analysis uses analytical areas rather than uniformly separate districts: Larut dan Matang and Selama form one combined area. Both medians use the same 141 analytical areas with at least one matched premise; the 24 areas without matches are excluded. These thresholds are descriptive, not standards of adequate provision; areas outside the selected group are not necessarily adequately served.
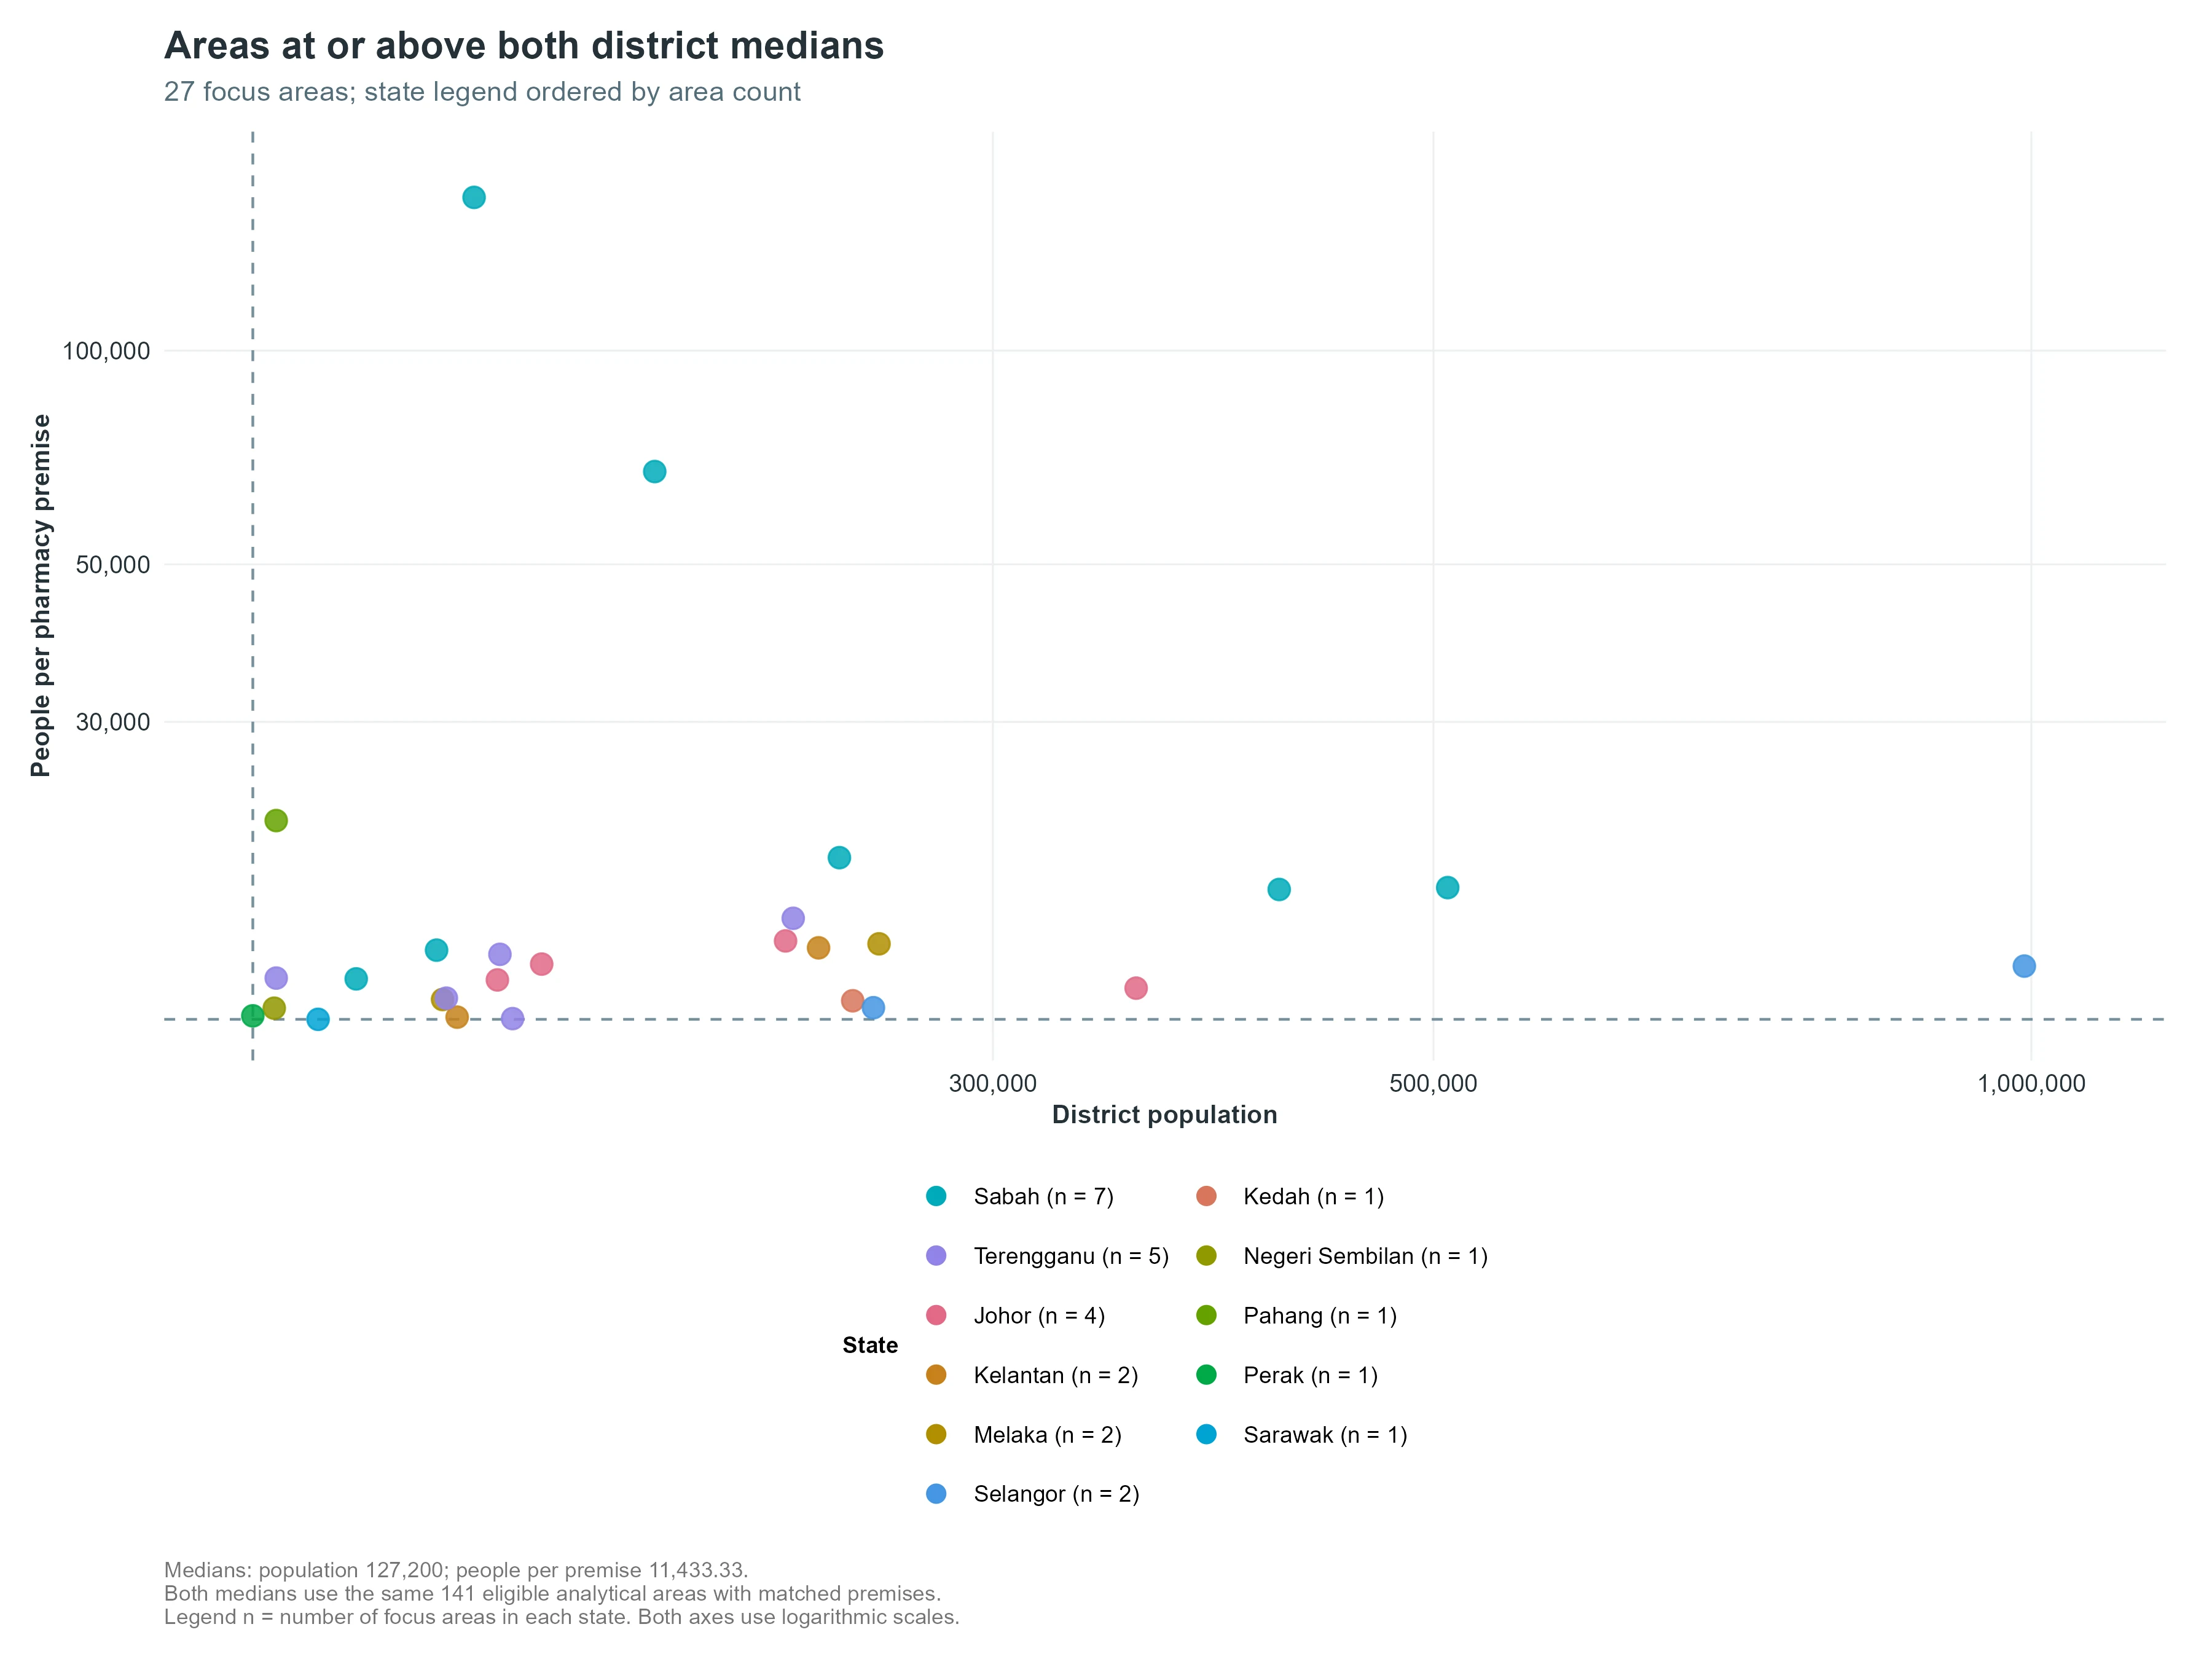
The 27 areas selected for closer assessment
Sabah contributes seven selected areas, Terengganu five and Johor four, together accounting for 59.3% of the group. Kelantan, Melaka and Selangor contribute two each; Kedah, Negeri Sembilan, Pahang, Perak and Sarawak contribute one each. The spread across 11 states shows that relatively large populations combined with high people-per-premise ratios are not confined to East Malaysia. Johor’s four selected areas are consistent with its above-national state ratio. Counts show each state’s representation among the 27 selected areas and provide a basis for examining the individual areas more closely.
Storefront pharmacy brands by size
A storefront brand is the name used by a pharmacy at its premises. This figure counts each identified storefront brand separately, even when several brands share an owner. Seven storefront brands have more than 100 premises each, together accounting for 1,442 premises (34.9% of all included premises). Another 47 brands have 6–100 premises. The 1–5-premise band contains 1,440 brands covering 1,788 premises. These are counts by storefront name, so a small brand is not necessarily an independently owned pharmacy. The next section combines brands into ownership-based brand groups.
Storefront pharmacy brands by premise-count band
Select a row to see its value.
No entry selected.
Storefront names are counted separately even where ownership is shared. The 2026 classification covers 4,087 identified-brand premises; 46 unidentified-brand premises remain in the national total. Historical counts come from the AIPharm.xyz 2022 report and are not confirmed comparable.
Largest pharmacy brand groups
A brand group brings together storefront brands assigned to the same owner where published ownership information supports the link. Unlike the previous figure, this comparison counts premises by brand group rather than storefront name. BIG CARiNG Group has the largest recorded footprint with 636 premises (15.4%), followed by Alpro Group with 277, Health Lane Family Pharmacy with 259 and PMG Healthcare Group with 191. The four groups together account for 33.0% of included premises. The ten largest groups account for 1,877 premises (45.4%); the remaining 2,256 include other classified groups and unresolved classifications, so they cannot all be described as independent pharmacies. These totals show the scale of classified networks within the included dataset; they do not show revenue or dispensing volumes.
Largest classified pharmacy brand groups
Select a row to see its value.
No entry selected.
Shares use all 4,133 included premises, including unresolved classifications, and do not measure sales, patients or dispensing activity.
Independent and chain pharmacies
To compare independent and chain pharmacies, this report follows the Malaysia Competition Commission (MyCC). MyCC defines chain pharmacies as “pharmacies that own and operate more than one retail pharmacy outlet”, and stand-alone community pharmacies as retail-only pharmacies that “operate only one outlet” (MyCC, 2017).
The independent-versus-chain classification uses the same brand groups as the preceding analysis to approximate ownership. Groups with one included premise are classified as independent pharmacies; groups with two or more premises are classified as chains. The 4,087 premises with an identified brand belong to 1,482 brand groups. Their distribution is shown below, alongside the 46 premises without an identified brand.
- Independent (single-outlet) pharmacies: 1,224 premises (29.6%), each the only premise in its brand group.
- Chain pharmacies: 2,863 premises (69.3%) belong to 258 brand groups with two or more premises. These comprise:
- small chains (2–10 premises): 234 groups, 714 premises (17.3%);
- large chains (11–100 premises): 18 groups, 553 premises (13.4%);
- mega chains (more than 100 premises): 6 groups, 1,596 premises (38.6%).
- Brand not identified: 46 premises (1.1%) are shown separately and are not assumed to be independent.
The small, large and mega chain bands are this report’s own groupings.
Independent pharmacies and chains by size
2026 · 4,133 included premises
- Independent29.6%1 premise1,224 premises · 1,224 brand groups
- Small chain17.3%2–10 premises714 premises · 234 brand groups
- Large chain13.4%11–100 premises553 premises · 18 brand groups
- Mega chain38.6%More than 100 premises1,596 premises · 6 brand groups
- Brand not identified1.1%Shown separately46 premises
Each square represents approximately 1%. The percentages use exact premise counts.
Leading pharmacy brand group by state
The following state comparisons continue to use brand groups, rather than individual storefront brands or the chain-size bands above. BIG CARiNG Group leads by premise count in eight states and federal territories. PMG Healthcare Group leads in Sabah, Sarawak and Labuan; Farmasi Lautan in Kelantan and Terengganu; Mega Kulim Pharmacy in Kedah; Alpro Group in Negeri Sembilan; and VCare Pharmacy in Putrajaya. VCare has the highest leading-group share at 23.5%, followed by Farmasi Lautan’s 23.2% in Terengganu. No identified group reaches 25% in any state or federal territory. Kedah’s leading group accounts for 8.2% of included premises, compared with Putrajaya’s 23.5%, showing how the leading group’s share varies between areas.
Leading pharmacy brand group in each state
Select a row to see its value.
Sabah: 15 % of included state premises
PMG Healthcare Group
State footprints of the ten largest pharmacy groups
BIG CARiNG Group has recorded premises in all states and federal territories, while Alpro Group and Watsons are represented everywhere except Labuan. Other groups have more concentrated footprints. Health Lane has 160 of its 259 premises in Selangor and Kuala Lumpur, compared with 75 of 129 for Sunway Multicare and 79 of 88 for AA Pharmacy. Mega Kulim is concentrated mainly in Kedah and Pulau Pinang, while Farmasi Lautan’s recorded premises are confined to Kelantan and Terengganu. PMG’s largest recorded counts are in Sarawak (57), Johor (44) and Sabah (37). Among the ten groups shown, only PMG (37), BIG CARiNG (27) and Alpro (26) have more than five recorded premises in Sabah; other groups operating there are outside this chart’s scope.
BIG CARiNG Group in Sabah: 27 premises
636 included premises nationally. Select any cell to explore both its state and group.
Darker cells represent more recorded premises. Scroll horizontally to see all states; use Tab and Enter to select a cell.
| Pharmacy group | Johor | Kedah | Kelantan | Melaka | Negeri Sembilan | Pahang | Perak | Perlis | Pulau Pinang | Sabah | Sarawak | Selangor | Terengganu | Kuala Lumpur | Labuan | Putrajaya |
|---|---|---|---|---|---|---|---|---|---|---|---|---|---|---|---|---|
| BIG CARiNG Group | ||||||||||||||||
| Alpro Group | ||||||||||||||||
| Health Lane Family Pharmacy | ||||||||||||||||
| PMG Healthcare Group | ||||||||||||||||
| Sunway Multicare Pharmacy | ||||||||||||||||
| Watsons | ||||||||||||||||
| AA Pharmacy | ||||||||||||||||
| Guardian | ||||||||||||||||
| Mega Kulim Pharmacy | ||||||||||||||||
| Farmasi Lautan |
Only the ten largest classified groups are shown. Zero means no recorded premises in the included dataset; it does not establish that a group has no operations there.
What the findings mean
Malaysia’s community-pharmacy footprint differs at both state and district levels. Sabah has the highest population per included premise and per active licence record, while Kuala Lumpur has the lowest. Sarawak’s below-national state ratio coexists with districts among the highest ratios, showing why state averages alone cannot describe local availability. The income comparison adds context, but its exceptions show that income alone does not explain where premises are located.
The district screening identifies 27 analytical areas that combine relatively large populations with high people-per-premise ratios. Their spread across 11 states makes closer assessment relevant beyond East Malaysia. These areas provide a starting point for examining local conditions, alongside the 24 analytical areas without matched premises.
Overall, the findings support closer investigation of local availability and group distribution, while differences in historical coverage and reference dates prevent firm conclusions about further national decline or consolidation.
Limitations
This analysis counts included community-pharmacy premises and active Type A licence records, not verified pharmacist headcounts or staffing capacity. Population per premise describes relative availability, not travel distance, service quality or whether local needs are met.
Geographic matching remains incomplete: 24 analytical areas in the district analysis have no matched premises, while 24 premises in Selangor have unresolved district assignments. No matched premises does not necessarily mean no pharmacy exists. Income data refer to 2024, while population and premise data refer to 2026; associations should not be interpreted as causal.
Brand-group results depend on the ownership links identified. Forty-six premises without an identified storefront brand are excluded from storefront-brand and brand-group counts. They are shown separately in the independent-versus-chain figure and remain in the national total. Single-premise brand groups are an approximation of independent ownership; unidentified links between owners and other premises may overstate their share.
Methodology and sources
This analysis updates AIPharm.xyz’s 2022 community-pharmacy report using official registers and public sources. It examines premise and licence distributions, population and income comparisons, and pharmacy-group footprints. No interviews or surveys were conducted.
1. Data sources
- Pharmacy licences: MOH Type A licence register, extracted on 27 September 2026 (8,374 licence rows).
- Population: DOSM 2026 estimates. Household income: DOSM Household Income and Expenditure Survey 2024. These datasets describe different reference years.
- Figures for community premises: Laporan Statistik 2025 PROGRAM PERKHIDMATAN FARMASI (PHARMACEUTICAL SERVICES PROGRAMME)
- Chain ownership and outlet numbers: chain websites, store locators and news reports.
- Malaysia Competition Commission (MyCC). (2017). Market Review on Priority Sector under Competition Act 2010 – Pharmaceutical Sector. Kuala Lumpur: MyCC.
2. Data processing
- In-force retail licences: Retail-capable licences valid on 27 September 2026 were retained, including retail-only and wholesale-and-retail licences. Wholesale-only licences and licences not valid on that date were excluded, leaving 6,473 licence records.
- Licences grouped into premises: licences at the same shop address were grouped, so each premise counts once.
- Community pharmacies only: clinics, hospitals, government, veterinary and distributor premises were excluded, along with premises where the evidence was insufficient. The final analytical dataset contains 4,133 included community-pharmacy premises associated with 4,747 active Type A licence records.
- Storefront brands were assigned where identifiable. Before counting, storefront-brand and brand-group names were standardised for letter case, punctuation and repeated spaces so that formatting variants were counted consistently in both analyses. Storefront brands were counted separately; brands assigned to the same owner were combined into brand groups where published ownership information supported the link. Premises without an identified brand were retained in the overall premise count.
- Supply measures: premises were matched to states and districts to calculate people per pharmacy. These were then compared with population and household income.
3. Validation
Counts for 12 selected chains, covering 1,928 included premises (46.6% of the total), were compared with published outlet references. Table 1 below presents the detailed comparison and its qualifications.
Table 1. Comparison of study premise counts with published outlet references
Detailed outlet comparison table
12 of 12 brand comparisons. Scroll the table horizontally for sources.
| Brand group | Our count | Published count | Published figure as stated | Study count ÷ published reference (%) | Source | Source date |
|---|---|---|---|---|---|---|
| BIG CARiNG Group | 636 | 600 | 600+ | 106% | Big Caring Group website | Oct 2026 |
| Alpro Group | 277 | 300 | 300+ | 92% | Alpro website | Undated |
| Health Lane Family Pharmacy | 259 | 250 | 250+ | 104% | Health Lane website | 2026 |
| PMG Healthcare Group | 191 | 200 | 200+ pharmacies | 96% | UKAS (Sarawak govt news) | Undated |
| Sunway Multicare Pharmacy | 129 | 120 | 120+ | 108% | Sunway Multicare website | 2026 |
| Watsons (stores with pharmacist) | 104 | 101 | 101 | 103% | Watsons store finder | Oct 2026 |
| AA Pharmacy | 88 | 84 | 84 | 105% | AA Pharmacy profile | 2026 |
| Guardian (stores with pharmacist) | 86 | 100 | ~100 | 86% | The Edge | May 2025 |
| Mega Kulim Pharmacy | 57 | 50 | 50+ | 114% | Mega Kulim website | Oct 2026 |
| Farmasi Lautan | 50 | 51 | 51 | 98% | Malaysiakini announcement | Sep 2026 |
| HTM Pharmacy | 37 | 42 | 42 | 88% | HTM store locator | Oct 2026 |
| All Day Pharmacy (incl. Nova Health Mart) | 14 | 15 | 15 | 93% | All Day locations page | Apr 2026 |
| Total | 1928 | 1913 | 1,913+ (minimum) | 101% |
Note: Published references differ in date and scope. “+” indicates a lower bound and “~” an approximate figure. Comparison percentages are not accuracy rates, and an overall agreement percentage cannot be calculated.

Jenny Liew
PHARMACIST | DATA SCIENCE | HEALTHCARE ANALYTICS
A pharmacist and MSc Data Science and Analytics student at Universiti Kebangsaan Malaysia (UKM).
View author profile